
The district average fell 0.5% in September to £531,380, down 1.3% on a year, the weakest since May 2024. Flats fell 3.8% and detached homes dipped below £1m.
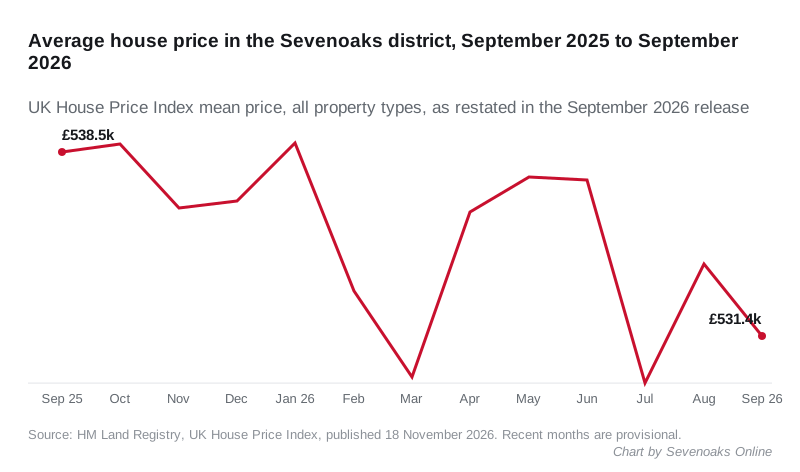
The average home in the Sevenoaks district sold for £531,380 in September. That is £2,763 less than in August, a fall of 0.5 per cent in the month. (HM Land Registry, UK House Price Index: Sevenoaks, September 2025 to September 2026)
Over the year the district is down £7,107, or 1.3 per cent. That is the weakest annual figure since May 2024, when it was also minus 1.3 per cent.
The figures were published at 9.30am on Wednesday 18 November. The next set, covering October, is due at 9.30am on Wednesday 16 December. (GOV.UK, UK House Price Index summary: September 2026)
August was not a rise after all
Last month we reported that August rose to £535,810, up 0.4 per cent on a year. This release cuts August to £534,143. On the restated figures, August was exactly level with August 2025, not up.
Earlier months have moved down too:
- July: from £532,468 to £529,546
- June: from £540,999 to £537,408
That removes June as the high point of the past year. On the new figures the highest month is January 2026, at £538,817.
Revisions like these are routine. The index is built from sales registered with the Land Registry, and registrations arrive for months after a sale completes. September’s £531,380 is a first estimate and will move. (GOV.UK, UK House Price Index summary: September 2026)
Every type of home fell
Every property type is down on a year, and flats by the most:
| Property type | Average price, September 2026 | Change on a year |
|---|---|---|
| Detached | £997,041 | -1.0% |
| Semi-detached | £531,552 | -0.6% |
| Terraced | £420,982 | -1.1% |
| Flats and maisonettes | £275,499 | -3.8% |
(HM Land Registry, UK House Price Index: Sevenoaks)
The detached average is below £1m again, a month after we reported it back above that line. The average semi now costs almost exactly the same as the district average for all homes.
Sevenoaks is now among Kent’s weaker areas
Sevenoaks remains the most expensive council area in Kent. It is £77,568 ahead of Tunbridge Wells, at £453,812, and £185,777 above the Kent average of £345,603. Thanet is the cheapest at £263,112.
A month ago only four Kent areas matched or beat Sevenoaks on annual growth. Now only two do worse:
| Area | Average price, September 2026 | Change on a year |
|---|---|---|
| Canterbury | £345,166 | +2.8% |
| Gravesham | £347,807 | +2.3% |
| Tonbridge and Malling | £406,706 | +1.5% |
| Swale | £293,546 | +1.4% |
| Medway | £296,831 | +0.7% |
| Tunbridge Wells | £453,812 | +0.7% |
| Maidstone | £352,666 | +0.2% |
| Dover | £282,507 | -0.5% |
| Ashford | £344,795 | -0.7% |
| Sevenoaks | £531,380 | -1.3% |
| Thanet | £263,112 | -3.0% |
| Dartford | £338,982 | -5.8% |
(HM Land Registry, UK House Price Index, September 2026)
Folkestone and Hythe is missing from the table because the Land Registry’s open data service returned no September figure for it on publication day.
Dartford, next door, still has the steepest fall in the county. Kent as a whole is down 0.3 per cent and the South East is down 0.2 per cent. England is up 0.8 per cent, and the UK is up 1.2 per cent to an average of £273,000. London is down 3.5 per cent. (GOV.UK, UK House Price Index summary: September 2026)
What it means for you
If you are buying your first home here, the district’s average first-time buyer price in September was £402,270, down 1.3 per cent on a year. First-time buyers pay no stamp duty up to £300,000 and 5 per cent on the portion from £300,001 to £500,000. At the average price, that is a bill of about £5,114. (GOV.UK, Stamp Duty Land Tax: residential property rates)
If you are selling, the district has gone from flat to slightly down in a month, while most of Kent is still rising. If you are staying put, none of this moves your council tax: bands are set on 1991 values.
To see what actually sold on your own street, use the Land Registry’s Price Paid Data search. It lists every registered sale by address. Our explainer on Sevenoaks house prices covers how the market splits by area.
One caution on the number
The UK House Price Index average is a mean, not a median. A single multi-million-pound sale lifts a district mean in a way it could never lift a median, and this district has plenty of homes that sell for that. £531,380 is the centre of gravity of the market, not the price of a typical family home.
Sources
- HM Land Registry, UK House Price Index: Sevenoaks, September 2025 to September 2026
- GOV.UK, UK House Price Index for September 2026
- GOV.UK, UK House Price Index summary: September 2026
- GOV.UK, Stamp Duty Land Tax: residential property rates
- HM Land Registry, Price Paid Data search
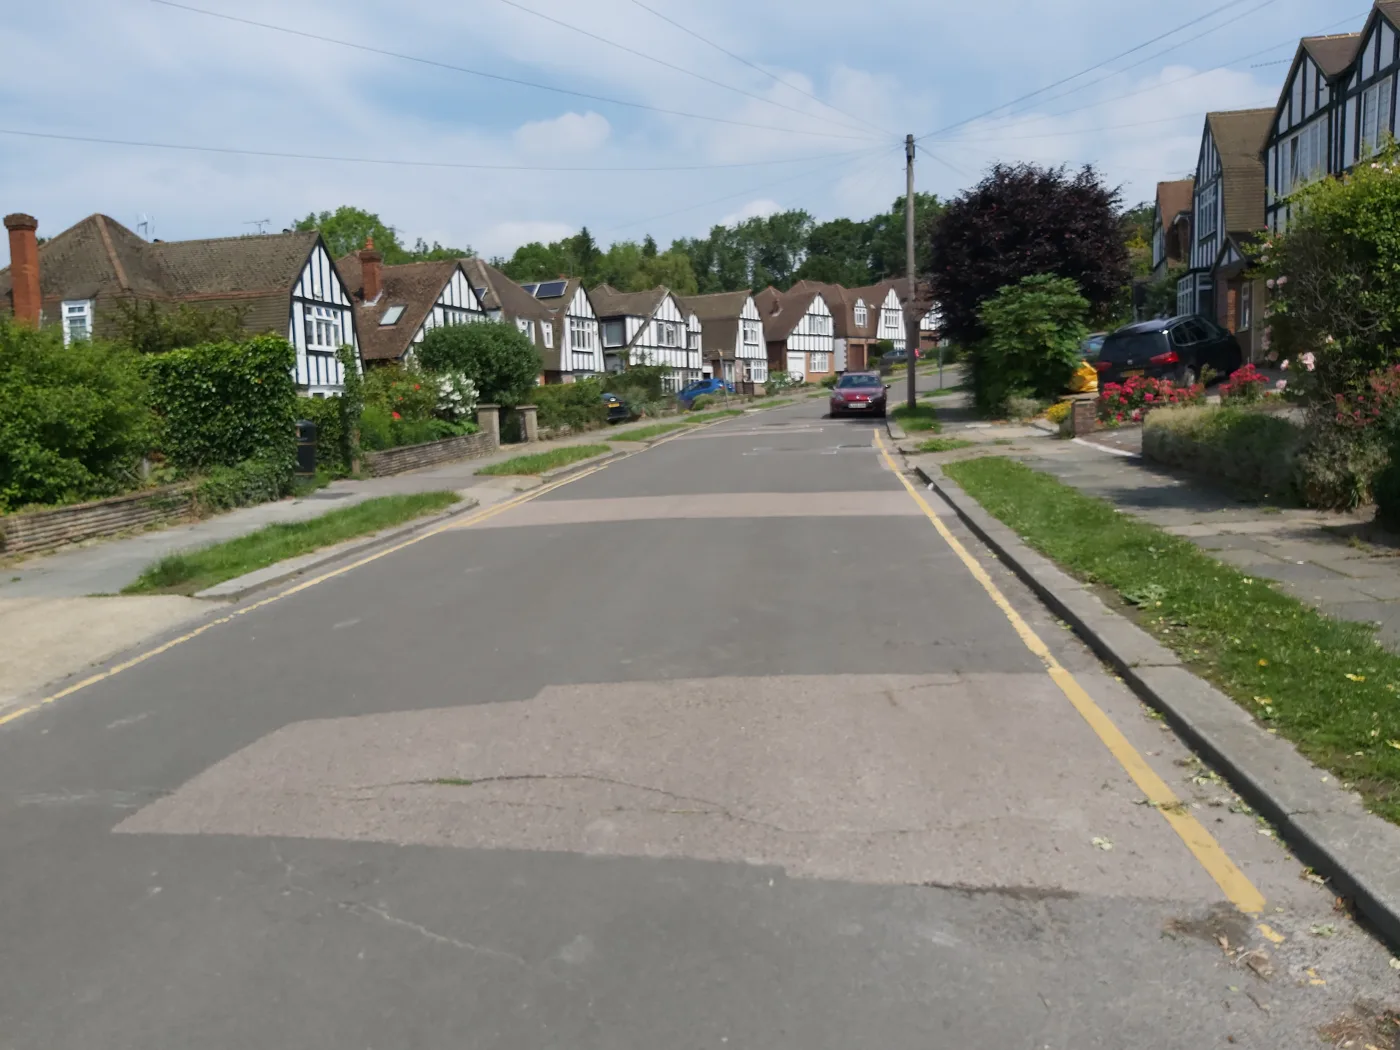
Image: Residential Street in Otford by John P Reeves, CC BY-SA 2.0 (https://creativecommons.org/licenses/by-sa/2.0), via Geograph and Wikimedia Commons. Resized and cropped to fit.
Have your say