
The average private rent in Sevenoaks reached £1,809 a month in August 2026, up 5.0% in a year and dearer than 10 London boroughs. What each size costs.
House prices get reported every month. Rents, which is what most people under forty in this district actually pay, get reported almost never, and the numbers that do circulate are usually asking rents scraped off portals: what landlords hope for, not what tenants hand over. The Office for National Statistics now publishes the other figure, district by district, covering existing tenancies as well as new ones. This is what it says about Sevenoaks.
The quick answer
The average private rent in the Sevenoaks district was £1,809 a month in August 2026, the most recent month published. That is up 5.0% in a year, an extra £87 a month or £1,044 a year on the £1,722 of August 2025. Sevenoaks is the most expensive district in Kent to rent in, £234 a month clear of second-placed Dartford, and it costs more than 10 of London’s 32 boroughs, Bromley and Croydon among them. The figures come from the ONS Price Index of Private Rents, published on 16 September 2026. The next update lands on 21 October.
The slowdown has reversed
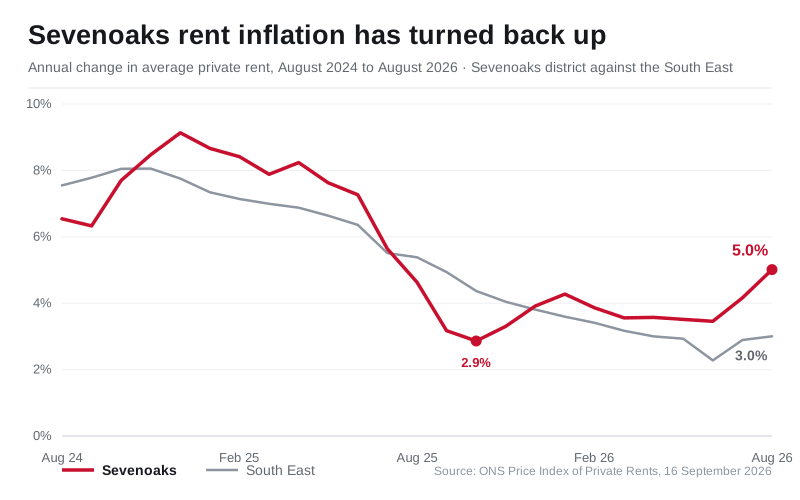
A year ago the story here was rents coming off the boil. Sevenoaks rent inflation peaked at 9.1% in December 2024, then fell over the following ten months to 2.9% in October 2025, its lowest reading since June 2023 and comfortably below the South East’s 4.4%.
That has turned around. The district has now climbed back for three months running: 3.5% in June, 4.2% in July, 5.0% in August. Over the same three months the South East barely moved, going 2.3%, 2.9%, 3.0%. A year ago Sevenoaks was rising more slowly than the region around it. It is now rising two percentage points faster.
In cash, the district average has gone from £1,711 in September 2025 to £1,809 last month, £98 a month added in under a year. On the ONS index, where January 2023 is set at 100, Sevenoaks stands at 119.2: rents here are 19.2% higher than they were three and a half years ago.
What each size of home costs
| Size | Sevenoaks | Annual change | South East | Sevenoaks premium |
|---|---|---|---|---|
| One bedroom | £1,266 | +5.2% | £993 | +£273 |
| Two bedrooms | £1,579 | +5.1% | £1,273 | +£306 |
| Three bedrooms | £1,926 | +5.2% | £1,552 | +£374 |
| Four or more | £2,952 | +4.2% | £2,213 | +£739 |
| All properties | £1,809 | +5.0% | £1,426 | +£383 |
The one-bedroom figure is the one worth sitting with. At £1,266 a month, a single flat in this district costs 27% more than the South East average for the same thing, and it is rising faster than the family houses above it. Rent inflation in Sevenoaks is not being driven by the big detached houses; the smallest homes are moving quickest.
By property type the ranking runs as you would expect, but the growth rates do not.
| Type | Average rent | Annual change |
|---|---|---|
| Detached | £2,750 | +4.3% |
| Semi-detached | £1,902 | +5.2% |
| Terraced | £1,655 | +5.4% |
| Flat or maisonette | £1,475 | +4.9% |
Terraced houses, the cheapest form of house in the district, are the fastest rising of the four at 5.4%. Detached homes, the dearest, are the slowest at 4.3%.
Sevenoaks against the rest of Kent
Every Kent district and Medway, ranked by what the average tenancy costs.
| Local authority | Average rent | Annual change |
|---|---|---|
| Sevenoaks | £1,809 | +5.0% |
| Dartford | £1,575 | +3.1% |
| Tunbridge Wells | £1,533 | +4.5% |
| Tonbridge and Malling | £1,489 | +3.2% |
| Gravesham | £1,336 | +5.3% |
| Maidstone | £1,297 | +3.0% |
| Canterbury | £1,280 | +5.4% |
| Ashford | £1,248 | +3.1% |
| Medway | £1,232 | +1.7% |
| Folkestone and Hythe | £1,178 | +10.6% |
| Thanet | £1,118 | +3.7% |
| Swale | £1,114 | +0.8% |
| Dover | £1,021 | +8.6% |
Sevenoaks tops the county by a distance. The £234 step down to Dartford in second is bigger than the whole drop from second place to fourth, which is £86. Renting the average home here costs £788 a month more than in Dover, £9,456 a year, inside the same county.
The fastest rises in Kent are at the cheap end, not the dear one: Folkestone and Hythe at 10.6% and Dover at 8.6% are the two steepest in the whole South East. Sevenoaks is the tenth fastest of the region’s 64 local authorities, which is unusual company for somewhere already this expensive.
Dearer than Bromley, and 10 other London boroughs
Sevenoaks is the third most expensive place to rent in the South East, behind Oxford at £1,963 and Elmbridge in Surrey at £1,891, and it sits 32nd of the 334 local authorities across Great Britain for which the ONS publishes a figure.
It also costs more than a third of London. These 10 boroughs are cheaper to rent in than the Sevenoaks district:
- Bexley, £1,537
- Sutton, £1,556
- Havering, £1,565
- Hillingdon, £1,570
- Croydon, £1,582
- Bromley, £1,684
- Barking and Dagenham, £1,698
- Redbridge, £1,726
- Waltham Forest, £1,763
- Harrow, £1,778
Bromley is the neighbour that stings. It is a London borough, inside the Oyster zone, on the same railway lines, and it is £125 a month cheaper than Sevenoaks. Part of what you pay for here is the schools and the countryside. Part of it, as our train times to London page sets out, is a fast service reaching Charing Cross in 32 minutes on an annual season frozen at £4,600 until 2027, which people will pay a premium to keep.
Renting against buying
The average Sevenoaks home sold for £538,714 in July 2026, the figure in our Sevenoaks house prices report, and it rose 1.0% over twelve months. Rents rose 5.0% over roughly the same period, five times as fast.
Put the two together and the average rent of £1,809 a month is £21,708 a year, which is 4.0% of the average sold price. That is our own arithmetic rather than an ONS figure, and it is a rough guide only: it sets a mean rent across the whole rented stock against a mean sale price across the whole market, and the two are not the same houses. It is still the direction that matters. The gap between what it costs to rent here and what it costs to buy here has narrowed over the past year, because rents moved and prices did not.
Over a longer run the picture flips. Sevenoaks rents are up 29.2% on August 2021, slightly less than the South East’s 31.1%. The district did not get expensive in the past five years. It was expensive already, and it has stayed that way while the rest of the region caught up a little.
What these figures are, and what they are not
A few things worth knowing before quoting any of the numbers above.
- They are actual rents, not asking rents. The ONS index covers the whole private rented stock, existing tenancies included, so it captures the tenant who has been in the same flat for six years on a below-market rent as well as the one signing today. Portal averages only see new listings, and they run higher.
- They are averages for the whole district, from Swanley and Edenbridge to Westerham and the town itself. There is no ONS figure for a single town or village. Rents in Sevenoaks town will be above the district number; rents in the north of the district will be below it.
- The latest month is provisional and gets revised. The ONS also classes the whole series as official statistics in development, meaning the method is still being refined.
- Rents are rounded to the nearest £1 and the index is set at 100 in January 2023, not 2015.
- The next release is 21 October 2026, covering September. We will update this page when it lands.
Where to check and what to do
- The full dataset is free: the ONS monthly price statistics spreadsheet carries every local authority back to January 2015, and the district you want is a search away in Table 1.
- If your landlord proposes a rise, the First-tier Tribunal (Property Chamber) can rule on whether a rent is above the market rate, and the figures on this page are the sort of evidence it weighs.
- Sevenoaks District Council’s housing advice service handles homelessness prevention and the housing register.
- What gets built next, and where, is being decided now: see our coverage of the Sevenoaks Local Plan and the sites allocated for housing across the district.
Frequently asked questions
How much is rent in Sevenoaks? The average private rent across the Sevenoaks district was £1,809 a month in August 2026, the latest month the Office for National Statistics has published. A one-bedroom home averaged £1,266, a two-bed £1,579, a three-bed £1,926 and a home with four or more bedrooms £2,952.
Is Sevenoaks the most expensive place to rent in Kent? Yes, and not narrowly. At £1,809 a month it is £234 clear of Dartford in second place and £788 above Dover, the cheapest of the county’s 13 local authority areas.
Are rents in Sevenoaks rising or falling? Rising, and rising faster than they were. Annual rent inflation in the district fell from 9.1 per cent in December 2024 to 2.9 per cent in October 2025, then turned back up: 3.5 per cent in June 2026, 4.2 per cent in July and 5.0 per cent in August. The South East as a whole was on 3.0 per cent in August.
Is it cheaper to rent in Bromley than in Sevenoaks? Yes. Bromley averaged £1,684 a month in August 2026, £125 less than Sevenoaks, despite being a London borough. Nine other London boroughs are also cheaper than the Sevenoaks district, including Croydon, Bexley and Sutton.
Do these figures include existing tenancies or only new lets? Both. The ONS index covers the whole private rented stock, so long-standing tenancies on below-market rents pull the average down. Figures quoted from property portals are asking rents on new listings, and they run higher.
When are the next figures published? On 21 October 2026, covering September. The ONS updates the series monthly and revises the most recent months, so this page is refreshed each time.
Sources
- ONS Price Index of Private Rents, UK: monthly price statistics (Table 1, local authority data to August 2026, released 16 September 2026, Crown copyright, Open Government Licence v3.0)
- ONS statistical bulletin, Private rent and house prices, UK (16 September 2026)
- HM Land Registry UK House Price Index (Sevenoaks district, July 2026, used for the sold-price comparison)
All figures on this page were read on 24 September 2026.
Have your say