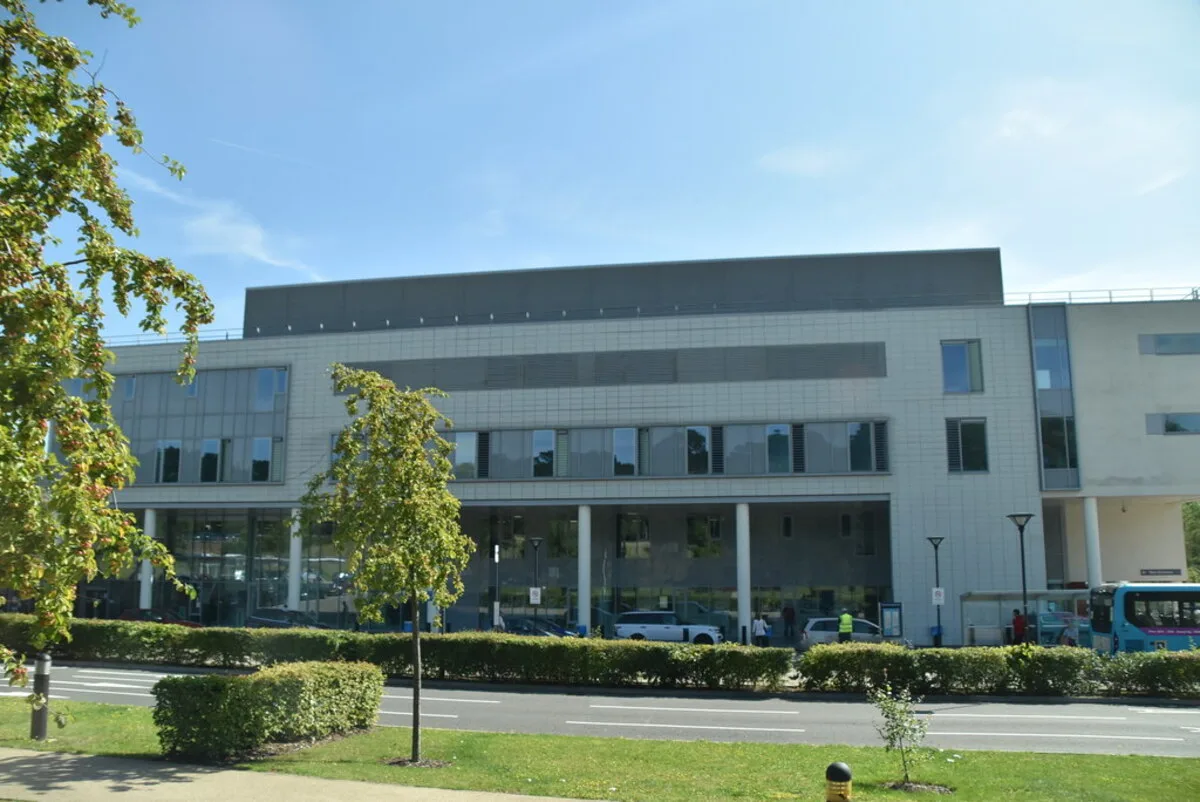

467 patients at the Maidstone and Tunbridge Wells hospitals waited over 12 hours for a bed in October, down from 686 but up from 317 a year ago.
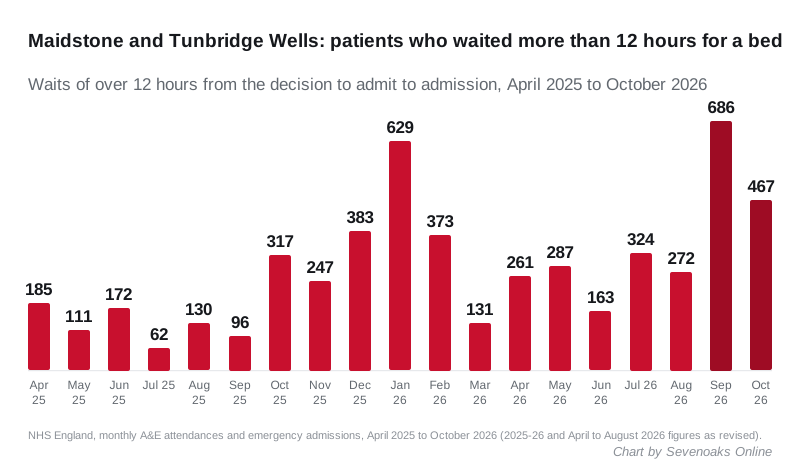
In October, 467 patients at Maidstone and Tunbridge Wells NHS Trust waited more than 12 hours for a hospital bed after A&E decided to admit them. That is down from 686 in September, the trust’s worst month since at least April 2025.
It is still almost half as many again as a year earlier, when the figure was 317. The trust runs the emergency departments at Tunbridge Wells Hospital in Pembury and at Maidstone Hospital. (NHS England, A&E Attendances and Emergency Admissions, October 2026)
The trust saw 77.2 per cent of its A&E patients within four hours in October. That is up from 74.9 per cent in September, but below the 79.8 per cent of October 2025. NHS England published the October figures on 12 November.
The three A&Es nearest the district
The Sevenoaks district has no major emergency department of its own. Residents are most likely to end up at one of three trusts. Here is how each did in October 2026, against October 2025.
| Trust | A&E attendances | Seen within 4 hours | A year earlier | Waited 12+ hours for a bed | A year earlier |
|---|---|---|---|---|---|
| Maidstone and Tunbridge Wells (Pembury, Maidstone) | 22,957 | 77.2% | 79.8% | 467 | 317 |
| Dartford and Gravesham (Darent Valley Hospital) | 16,729 | 79.4% | 80.4% | 357 | 112 |
| King’s College Hospital (includes the PRUH, Farnborough) | 27,717 | 68.0% | 71.3% | 894 | 593 |
| England | 2,500,999 | 74.0% | 74.2% | 57,840 | 54,326 |
All figures are NHS England’s monthly provider data for each trust as a whole. (NHS England, A&E by provider, October 2026) The October 2025 figures are the revised ones from the previous year’s series. (NHS England, A&E Attendances and Emergency Admissions 2025-26)
What the table shows:
- Darent Valley’s trolley waits more than tripled. Dartford and Gravesham recorded 357 waits of over 12 hours for a bed, against 112 a year earlier. Its four-hour figure of 79.4 per cent is its lowest since June 2025.
- King’s had its worst four-hour month since January. It saw 68.0 per cent within four hours, against 67.5 per cent in January 2026. Its figures also cover King’s College Hospital in Denmark Hill, not only the PRUH.
- The national picture worsened too. England’s 57,840 trolley waits were the most in any month since January 2026, when there were 71,517.
Hospital by hospital
NHS England also publishes figures for each hospital from the Emergency Care Data Set. These cover major emergency departments only, not minor injury units or urgent treatment centres, which is why the shares are lower than the trust headlines. The October figures are provisional, rounded to the nearest five, and published as experimental statistics. (NHS England, ECDS Performance, October 2026, provisional)
| Hospital | Attendances | Seen within 4 hours | Admitted patients within 4 hours | In A&E over 12 hours |
|---|---|---|---|---|
| Tunbridge Wells Hospital, Pembury | 8,935 | 69.4% | 18.0% | 1,135 (12.7%) |
| Maidstone Hospital | 9,065 | 77.6% | 17.6% | 585 (6.5%) |
| Darent Valley Hospital, Dartford | 12,385 | 72.3% | 52.2% | 1,115 (9.0%) |
| Princess Royal University Hospital, Farnborough | 6,750 | 48.8% | 11.6% | 965 (14.3%) |
| England | 1,604,647 | 60.7% | 28.9% | 171,680 (10.7%) |
The 12-hour column here is a different measure from the trolley waits above. It counts everyone who spent more than 12 hours in the department from arrival, whether or not they were admitted.
Pembury improved a little on September. In the finalised September figures it saw 67.4 per cent of patients within four hours, and 1,265 spent more than 12 hours in A&E. (NHS England, ECDS Performance, September 2026, finalised)
Two things have not changed:
- Patients who need a bed still wait longest. At Pembury and Maidstone, fewer than one in five admitted patients left A&E within four hours. At the PRUH it was about one in nine.
- More than one Pembury patient in eight spent over 12 hours in A&E. At the PRUH it was one in seven.
Sevenoaks Hospital, run by Kent Community Health NHS Foundation Trust, recorded 1,715 attendances in October. None lasted longer than 12 hours.
What the two measures mean
The four-hour figure is the share of everyone who came to A&E who was admitted, transferred or discharged within four hours of arriving. The 12-hour figure in the trust table is narrower. It counts patients who waited more than 12 hours between a doctor deciding to admit them and actually getting a bed on a ward. These are often called trolley waits.
The 12-hour count does not include people who waited 12 hours or more and then went home. (NHS England, A&E Attendances and Emergency Admissions)
Maidstone and Tunbridge Wells, month by month
The trust’s four-hour figure was above 80 per cent through most of spring and summer 2025. It has not reached 81 per cent in any month since September 2025, and fell to 74.9 per cent in September 2026.
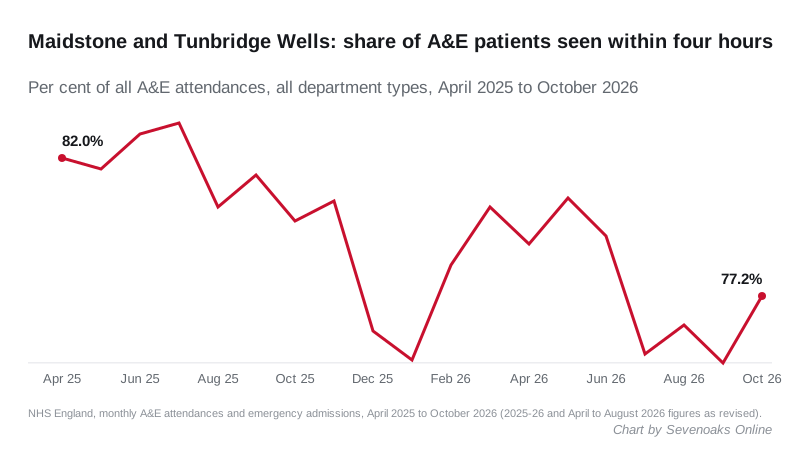
October’s 467 trolley waits are the trust’s third highest in the 19 months, behind September and January 2026.
| Month | Seen within 4 hours | Waited 12+ hours for a bed |
|---|---|---|
| April 2025 | 82.0% | 185 |
| May 2025 | 81.6% | 111 |
| June 2025 | 82.8% | 172 |
| July 2025 | 83.2% | 62 |
| August 2025 | 80.3% | 130 |
| September 2025 | 81.4% | 96 |
| October 2025 | 79.8% | 317 |
| November 2025 | 80.5% | 247 |
| December 2025 | 76.0% | 383 |
| January 2026 | 75.0% | 629 |
| February 2026 | 78.3% | 373 |
| March 2026 | 80.3% | 131 |
| April 2026 | 79.0% | 261 |
| May 2026 | 80.6% | 287 |
| June 2026 | 79.3% | 163 |
| July 2026 | 75.2% | 324 |
| August 2026 | 76.2% | 272 |
| September 2026 | 74.9% | 686 |
| October 2026 | 77.2% | 467 |
The four-hour shares are calculated from NHS England’s monthly CSV files, counting all A&E departments and booked appointments, which is how NHS England calculates its own headline figure. For October 2026 they match the published provider table. NHS England revised its April to August 2026 files on 12 November, and the table uses the revised figures. September is as first published. (NHS England, A&E Attendances and Emergency Admissions 2026-27)
The target
NHS England’s planning framework sets every trust a goal of seeing 82 per cent of A&E patients within four hours by March 2027. (NHS England, Medium term planning framework: delivering change together 2026/27 to 2028/29)
On October’s figures:
- Maidstone and Tunbridge Wells is 4.8 points short.
- Dartford and Gravesham is 2.6 points short.
- King’s College Hospital is 14.0 points short.
Winter is still to come. Last year the trust’s worst months were December and January.
What it means for you
- Call 999 in an emergency. None of these figures should put anyone off going to A&E when they need to.
- For anything urgent but not life-threatening, use NHS 111 first. It can book you a time at an urgent treatment centre or arrange a call back from a clinician. (NHS, When to use 111)
- Ambulance times are a separate problem. Our freedom of information figures show how long 999 calls in the TN13 to TN16 postcodes waited for an ambulance: Sevenoaks ambulance times: up to twice the 7-minute target.
September’s figures are in our earlier report. NHS England is due to publish November’s figures in December.
Sources
- NHS England, A&E Attendances and Emergency Admissions 2026-27 (monthly CSV and provider files, April to October 2026)
- NHS England, A&E by provider, October 2026
- NHS England, ECDS Performance by hospital site, October 2026 (provisional)
- NHS England, ECDS Performance by hospital site, September 2026 (finalised)
- NHS England, A&E Attendances and Emergency Admissions 2025-26 (revised monthly CSV files)
- NHS England, Medium term planning framework 2026/27 to 2028/29
- NHS, When to use 111
Image: Tunbridge Wells Hospital, by N Chadwick, CC BY-SA 2.0 (https://creativecommons.org/licenses/by-sa/2.0/), via Geograph (Wikimedia Commons file, Geograph 6571232). Charts by Sevenoaks Online. Resized and cropped to fit.
Have your say