
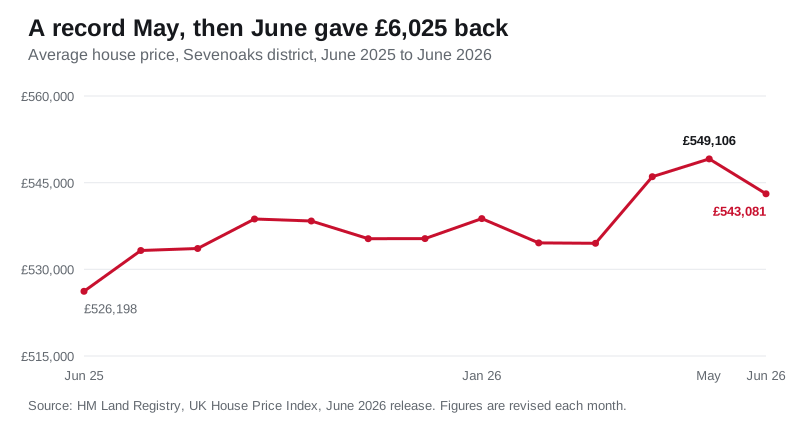
The district average slipped 1.1% in June to £543,081, and May's record was revised down £4,646. Sevenoaks is still Kent's dearest area by £97,948.
The average home in the Sevenoaks district sold for £543,081 in June, £6,025 less than in May. It is the first monthly fall since February, and the largest since June last year. Over the twelve months the district is still up £16,883, a rise of 3.2 per cent. (HM Land Registry, UK House Price Index: Sevenoaks, June 2025 to June 2026)
The figures were published at 9.30am today. The next set, covering July, is due at 9.30am on Wednesday 16 September. (GOV.UK, UK House Price Index reports)
Still the most expensive place in Kent, by a distance
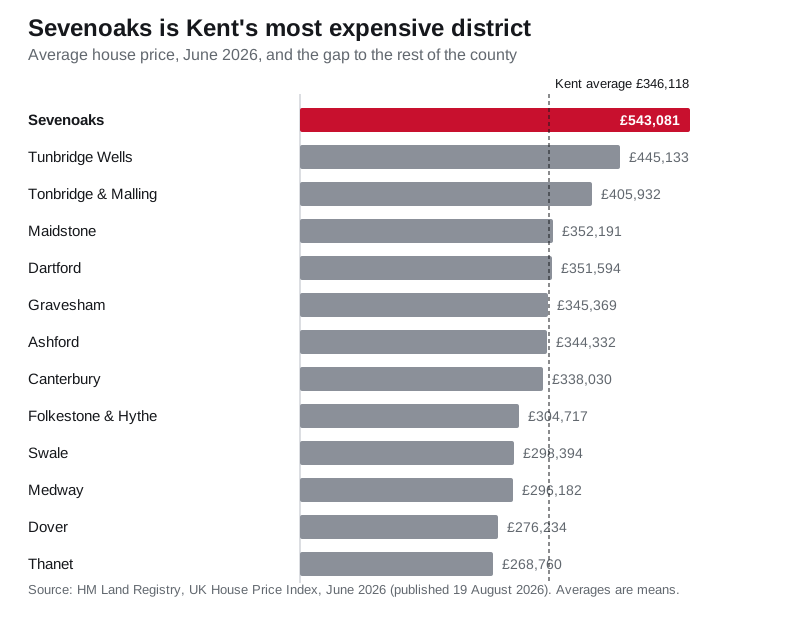
Sevenoaks is the dearest of Kent’s 13 local authority areas, and the gap is not close. The district average is £97,948 above second-placed Tunbridge Wells and £196,963 above the county average of £346,118. Thanet, the cheapest, averages £268,760. (HM Land Registry, UK House Price Index, June 2026 full file)
Set against all 295 local authority districts in England, Sevenoaks is the 25th most expensive. On annual growth it is far more ordinary: its 3.2 per cent ranks 135th, almost exactly mid-table. Sixty-two English districts recorded a fall over the year.
Several of them are next door. Tunbridge Wells is down 3.0 per cent, the only Kent area to fall. Bromley, over the London boundary, is down 1.4 per cent. Tandridge, the Surrey district on the far side of Westerham, is down 5.6 per cent, and Surrey as a whole is down 1.2 per cent. The South East region managed 0.3 per cent. Sevenoaks is going up while the expensive commuter belt around it is not.
Terraces and semis are pulling the average
The growth is in the middle of the market, not at the top:
- terraced homes: £429,801, up 4.4 per cent on the year
- semi-detached: £542,756, up 4.1 per cent
- detached: £1,017,388, up 2.1 per cent
- flats and maisonettes: £283,224, up 1.3 per cent
(HM Land Registry, UK House Price Index: Sevenoaks)
Detached homes in the district have averaged more than £1m in every month since July 2025. The distance between a semi and a detached house is now about £475,000, which is what makes the last step in the local ladder so hard.
Buyers using a mortgage paid £541,940 on average, up 3.4 per cent. Cash buyers paid £546,686, up 2.7 per cent.
We reported May’s figure. The Land Registry has since changed it
Last week this site reported that the district average had reached £553,752 in May, a record. In today’s release that same month has been restated at £549,106, £4,646 lower. April was cut from £549,523 to £546,035, and March from £538,647 to £534,503.
This is normal, and it is worth understanding rather than ignoring. The index is built from sales registered with the Land Registry, and sales keep arriving for months after they complete. Each release recalculates the recent months. May remains the district’s highest figure in a series running back to January 1995, but it is now a smaller record than it looked when the May index came out on 31 July.
The same effect runs the other way on transaction counts. March 2026 was published in the May release as 77 sales. Today it stands at 91. April is showing 64, and May and June are blank because too little has registered yet. Treat any recent sales count as incomplete, not as evidence that the market has stopped.
What it means for you
If you are buying your first home here, the number that matters is £411,385, the district’s average first-time buyer price in June. That is £14,977 higher than a year ago.
It also sits £111,385 above the £300,000 point where first-time buyers’ stamp duty relief stops. On a purchase at that price the bill works out at roughly £5,569, applying the 5 per cent rate that runs from £300,000 to £500,000. The thresholds dropped on 1 April 2025, when the nil-rate band fell from £250,000 to £125,000 and first-time buyers’ relief from £425,000 to £300,000. (GOV.UK, Stamp Duty Land Tax: residential property rates)
If you are selling, a single month’s dip is not a trend, and the annual direction is still up. If you are staying put, none of this changes your bill: council tax bands are set on 1991 values and do not move with the market. You can check yours on our guide to Sevenoaks council tax bands.
Two things worth holding together. Prices near a record, and unemployment claims in the district at a four-year high at 1,665 in July. The housing market here is not a straightforward read on the local economy.
To see what has actually sold on your own street rather than a district mean, use the Land Registry’s Price Paid Data search, which lists every registered sale by address. Our longer explainer on Sevenoaks house prices sets out how the market splits by area. For what is being built and where, see Sevenoaks planning applications.
One caution on the number
The UK House Price Index average is a mean, not a median. A single multi-million-pound sale lifts the district average in a way it could never lift a median, and this district has plenty of houses capable of doing that. £543,081 is the centre of gravity of the market, not the price of a typical family home.
Sources
- HM Land Registry, UK House Price Index: Sevenoaks, June 2025 to June 2026
- HM Land Registry, UK House Price Index full file, June 2026 (every local authority, every month)
- HM Land Registry, UK House Price Index full file, May 2026 (used to compare the revised figures)
- GOV.UK, UK House Price Index reports and release dates
- GOV.UK, Stamp Duty Land Tax: residential property rates
- HM Land Registry, Price Paid Data search
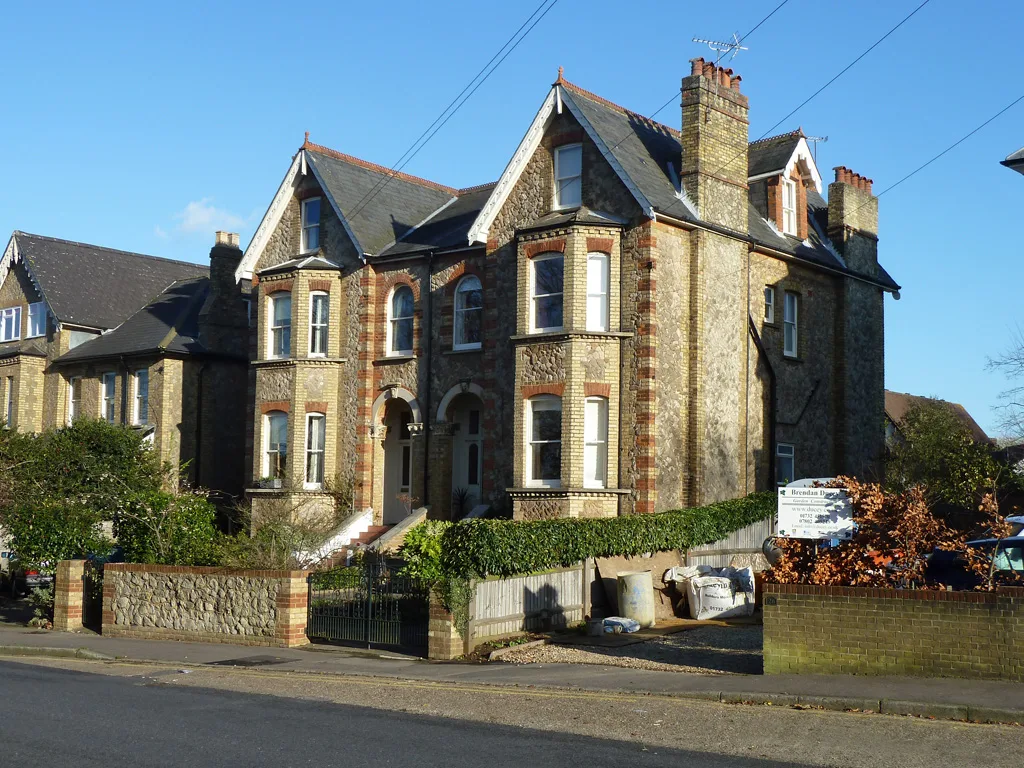
Image: Houses on Dartford Road, Sevenoaks by Robin Webster, CC BY-SA 2.0, via Geograph.
Have your say