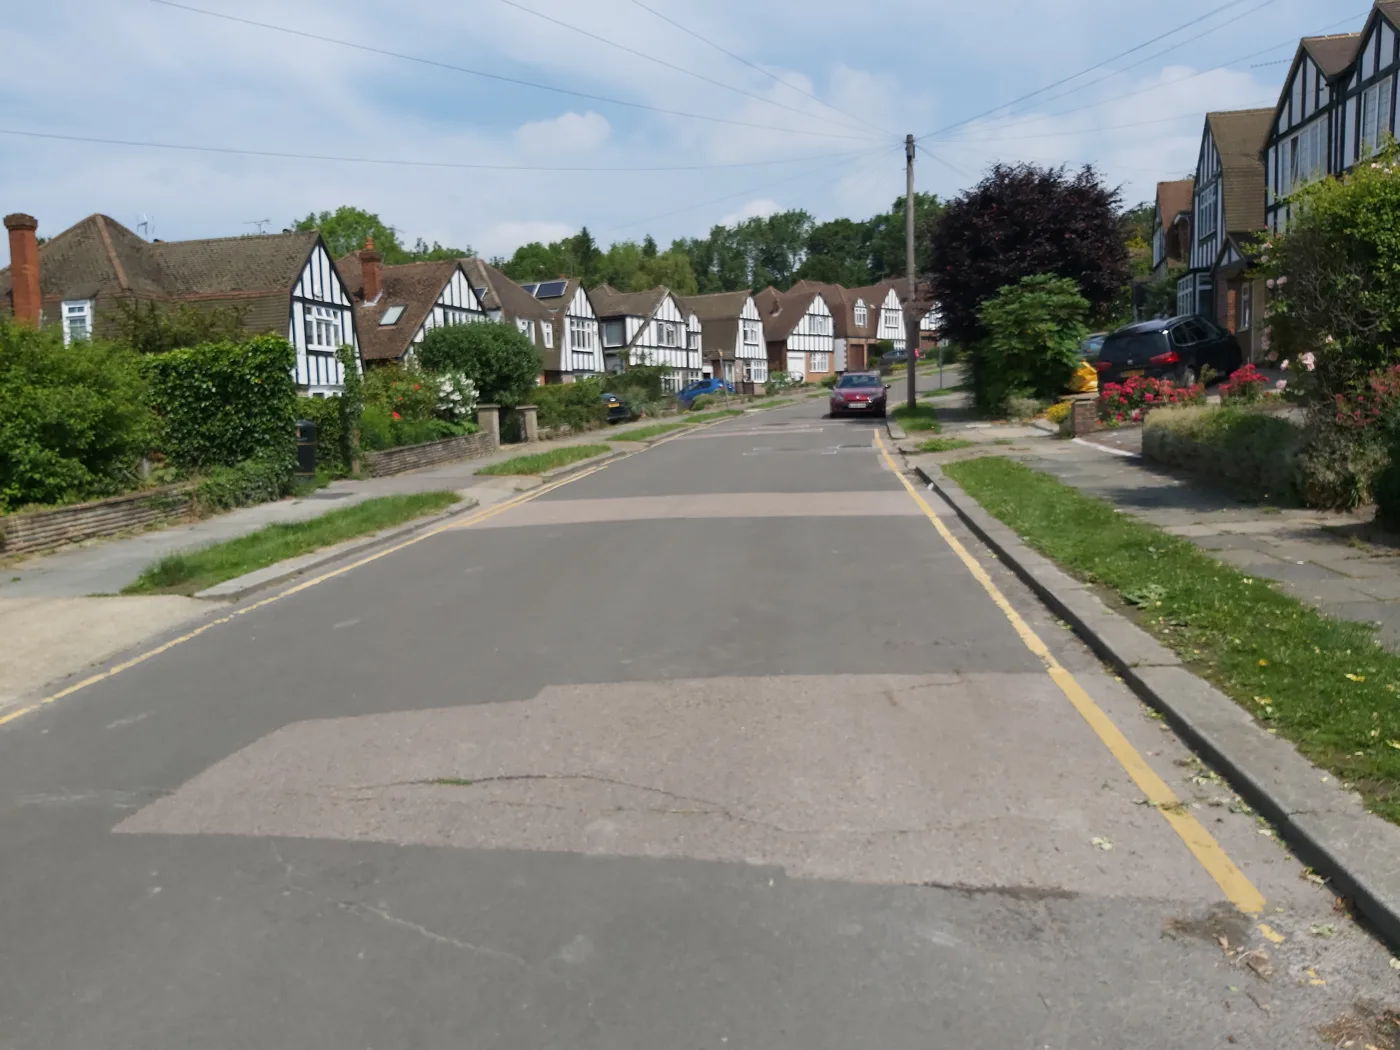

The district average hit £553,752 in May, up 3.9% in a year while Tunbridge Wells, Bromley and Dartford stood still. Land Registry figures by property type.
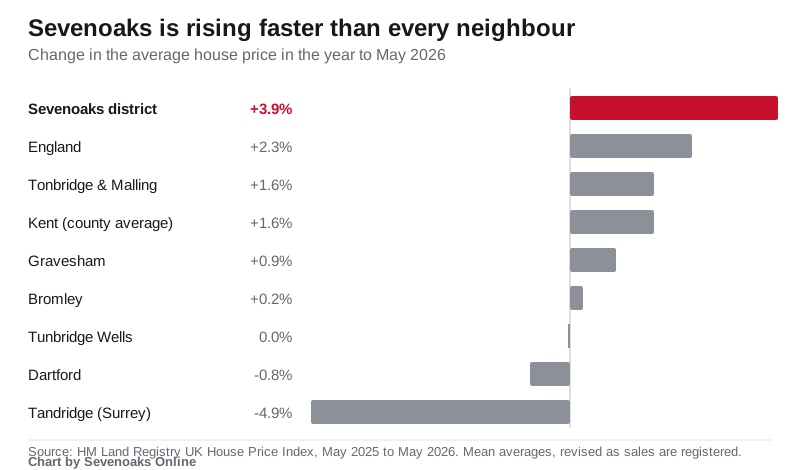
The average home in the Sevenoaks district sold for £553,752 in May, £20,952 more than a year earlier, a rise of 3.9 per cent that puts the district well ahead of Kent as a whole and of every neighbouring authority. (HM Land Registry, UK House Price Index: Sevenoaks, May 2025 to May 2026)
Across Kent the average rose 1.6 per cent over the same twelve months, to £345,918. In England it rose 2.3 per cent, to £292,095. Tunbridge Wells finished the year £151 lower than it started it, Dartford was down £2,579, Bromley just over the London boundary gained £1,276, and Tandridge, the Surrey district on the far side of Westerham, fell 4.9 per cent. On the Land Registry’s numbers, Sevenoaks is the outlier in this corner of the South East rather than part of a regional surge.
Semis are doing the work
The district’s headline figure is being pulled up by the middle of the market, not the top. Semi-detached homes averaged £554,534 in May, up 5.1 per cent on the year, and terraced homes £438,624, up 4.7 per cent. Detached homes rose 3.5 per cent to £1,034,141. Flats and maisonettes barely moved, up 0.9 per cent to £289,093. (HM Land Registry, UK House Price Index: Sevenoaks)
That gap matters if you are trading up. A semi in the district is now worth roughly the same as the district average, while the detached home someone might move into costs nearly twice as much, and the distance between the two has grown by about £8,000 in a year.
Detached prices in the district first passed £1m in the index in March 2023, dipped back below it, and have stayed above £1m in every month since July 2025. The May figures for the district average and for detached, semi-detached and terraced homes are each the highest in the Land Registry’s monthly series for Sevenoaks going back to at least October 2009. Flats are the exception: at £289,093 they are still short of the £290,079 they averaged in March 2025.
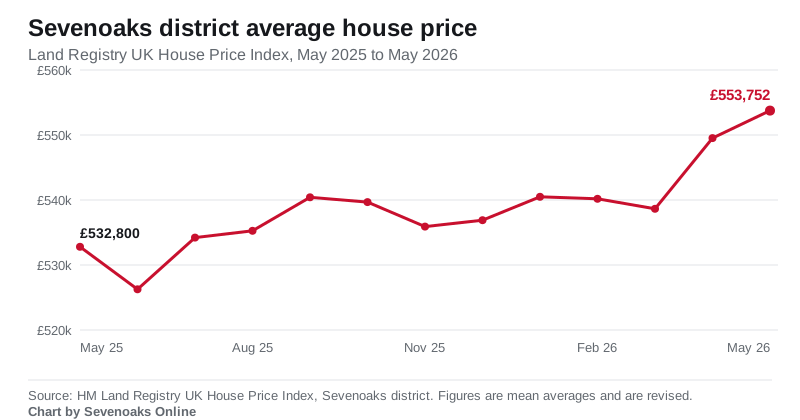
Most of the annual gain arrived in the last two months of the period. The district average sat between £535,000 and £541,000 from August 2025 through to March 2026, then jumped to £549,523 in April and £553,752 in May.
What the figures are, and what they are not
The UK House Price Index is built from completed sales registered with the Land Registry, so it records what buyers actually paid rather than what sellers asked. Two caveats matter when you read it.
First, the average is a mean, not a median. A single multi-million-pound sale lifts the whole district figure in a way it would not lift a median, and this district has plenty of houses capable of doing that. Treat £553,752 as the centre of gravity of the market, not as the price of a typical family house.
Second, the figures are provisional and get revised. The Land Registry recalculates each month as more sales complete and are registered, so the May number will change slightly, and figures for the last few months are built on incomplete sale counts. The index recorded 77 sales in the district in March 2026 against 312 in March 2025, but the recent count is the incomplete one and should not be read as a collapse in transactions.
The March 2025 spike is itself explained by the tax calendar. Stamp duty thresholds fell on 1 April 2025, with the nil-rate band dropping from £250,000 to £125,000 and first-time buyers’ relief from £425,000 to £300,000, which pushed buyers to complete before the deadline. (GOV.UK, Stamp Duty Land Tax: residential property rates)
What it means for you
If you are buying your first home here, the number to look at is £419,859, the average first-time buyer price in the district in May, up from £403,359 a year ago. That is £119,859 above the £300,000 point where first-time buyers’ relief runs out, so on a purchase at that price the stamp duty bill works out at about £5,990 (our calculation, applying the 5 per cent rate that applies between £300,000 and £500,000). A first-time buyer paying the same price before April 2025 would have paid nothing. (GOV.UK, Stamp Duty Land Tax: residential property rates)
If you are selling, the direction of travel is in your favour, but the movement is recent and concentrated in April and May. If you are staying put, the figures still reach you: council tax bands are set on 1991 values and do not move with the market, so a rising average changes what you could sell for, not what you pay each month. You can check your own band on our guide to Sevenoaks council tax bands.
To look up what has actually sold on your own street, rather than the district average, use the Land Registry’s own Price Paid Data search, which lists every registered sale by address. Our longer explainer on Sevenoaks house prices sets out how the local market splits by area and why agents’ asking prices read so much higher than these figures. For what is being built and where, see Sevenoaks planning applications.
Sources
- HM Land Registry, UK House Price Index: Sevenoaks district, May 2025 to May 2026
- HM Land Registry, UK House Price Index: Kent
- HM Land Registry, UK House Price Index: England
- HM Land Registry, UK House Price Index reports and guidance
- HM Land Registry, Price Paid Data search
- GOV.UK, Stamp Duty Land Tax: residential property rates
Image: Residential Street in Otford by John P Reeves, CC BY-SA 2.0, via Geograph. Charts by Sevenoaks Online, drawn from the Land Registry figures above.
Have your say