
August's claimant count hit 1,675, the highest since January 2022. Claims from 18 to 24 year olds are up 30 per cent in a year; under-22s up 42 per cent.
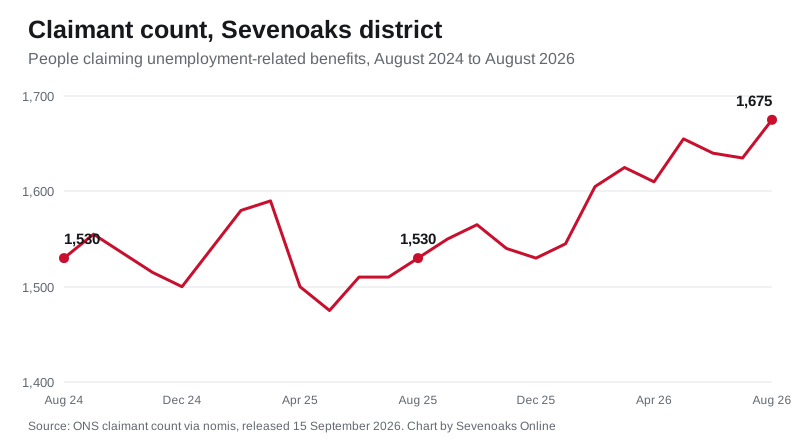
Sevenoaks unemployment claims rose to 1,675 in August, the district’s highest monthly figure since January 2022. The count is up 40 on July and up 145 on a year earlier, a rise of about 9.5 per cent over the twelve months. (ONS, Claimant count by sex and age, Sevenoaks, via nomis)
The claimant count measures people on unemployment-related benefits who are required to look for work. The Office for National Statistics published the August figures this morning. (ONS, UK labour market: September 2026)
August is the seventh month in a row above 1,600, a level the district last saw in February 2022 as the post-pandemic spike unwound. The only month in the past four and a half years with a higher figure than August’s is January 2022, at 1,705. (ONS, via nomis)
Young claimants are the sharpest movers
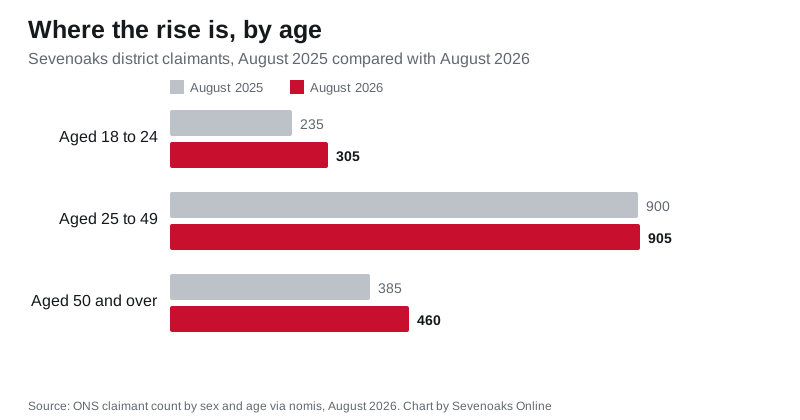
The pattern we reported in July’s figures has strengthened. The year’s rise sits almost entirely with the youngest claimants and the over-50s, while the large 25 to 49 group has barely moved.
Comparing August 2026 with August 2025:
- 18 to 24: up from 235 to 305, a rise of about 30 per cent
- 18 to 21 alone: up from 130 to 185, a rise of about 42 per cent
- 25 to 49: up from 900 to 905
- 50 and over: up from 385 to 460, a rise of about 19 per cent
(ONS, Claimant count by sex and age, Sevenoaks, via nomis)
When we reported the July figures we noted that summer school and college leavers would start to appear in the August and September counts. That is consistent with what August shows. The 18 to 24 count rose by 20 on the month, and the under-22 count by 15, while the 25 to 49 group rose by just 10. September’s release will show the rest of the leaver effect. (ONS, via nomis)
Still the lowest rate in Kent
Measured as a share of residents aged 16 to 64, the district’s August rate was 2.3 per cent. That remains the lowest of Kent’s twelve districts.
The August rate in each Kent district:
| District | Rate | Claimants |
|---|---|---|
| Sevenoaks | 2.3% | 1,675 |
| Tonbridge and Malling | 2.5% | 2,095 |
| Tunbridge Wells | 2.5% | 1,805 |
| Ashford | 2.9% | 2,515 |
| Canterbury | 3.2% | 3,200 |
| Dartford | 3.3% | 2,605 |
| Dover | 3.3% | 2,300 |
| Maidstone | 3.5% | 3,980 |
| Swale | 3.5% | 3,410 |
| Folkestone and Hythe | 3.8% | 2,450 |
| Gravesham | 4.3% | 2,960 |
| Thanet | 5.4% | 4,455 |
(ONS, Claimant count by sex and age, Kent districts, via nomis)
The wider picture moved the same way. Kent as a whole was on 3.4 per cent in August, the South East on 3.1 and the United Kingdom on 3.9. A year earlier those figures were 3.2, 3.0 and 3.8, against 2.1 per cent here. So the district rose 0.2 percentage points over the year, in step with the county, and stays well below all three benchmarks. (ONS, via nomis)
What this figure is, and what it is not
The claimant count is not the unemployment rate. It counts people claiming Universal Credit or Jobseeker’s Allowance who are required to look for work, which includes some people who are working but on low hours or low pay. Survey-based unemployment is measured differently and is not published monthly for an area this size.
Two standing caveats matter more than usual this month.
- The figures are rounded to the nearest five at district level, so small moves can be noise.
- They are revised. When we reported the July figure a month ago it stood at 1,665. The same series now puts July at 1,635, a downward revision of 30. August’s 1,675 is provisional and could move too. The trend over a year is more reliable than any single point.
What it means for you
If you are out of work here, or claiming while looking for more hours, support runs through your Universal Credit account or the helpline on the GOV.UK Universal Credit pages. Vacancies are advertised free on Find a job, and our Sevenoaks jobs page lists where local employers post openings. Careers advice, including for people under 25, is free from the National Careers Service.
If you want to check the figures yourself, the whole series is open. The ONS publishes it through nomis, where you can pick the Sevenoaks district, any month back to the 1990s, and breakdowns by age and sex. The next monthly update, carrying the September figures, is due on 20 October. (ONS, UK labour market: September 2026)
For the other half of the household ledger, our monthly reporting on Sevenoaks house prices tracks what the market is doing. Our guide to Sevenoaks council tax bands sets out what each band costs this year.
Sources
- ONS, Claimant count by sex and age (UCJSA), via nomis, released 15 September 2026, covering August 2026: Sevenoaks district count, rate, age breakdown, and the Kent, South East and UK comparisons
- ONS, Claimant count by sex and age, Kent district table, via nomis
- ONS, UK labour market: September 2026, for the 15 September release date and the 20 October next release
- GOV.UK, Universal Credit
- GOV.UK, Find a job
- National Careers Service
Image: shops opposite Sevenoaks railway station, photo by Des Blenkinsopp, CC BY-SA 2.0, via Geograph. Charts by Sevenoaks Online.
Have your say